



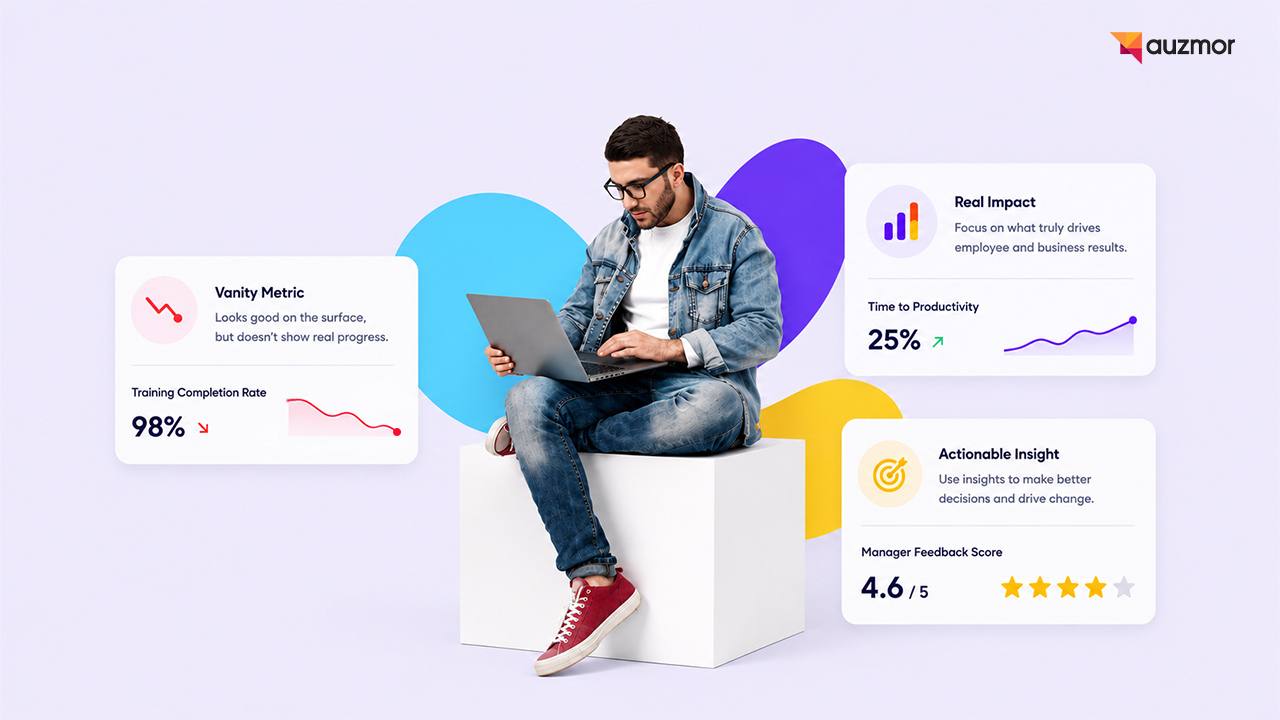
It is easy to understand why vanity metrics in employee metrics survive so long. They are visible, simple to report, and usually look better than the messier truth underneath. A high attendance rate, a full training dashboard, or a strong survey response count can make a team appear healthy even when the actual employee experience is uneven. That is exactly why leaders need to look past the number that is easiest to screenshot and ask what it really says about work, growth, and trust. For teams building people programs with tools like Auzmor, that distinction matters because the point is not to collect more data. It is to collect the right data.
What vanity metrics really are
Vanity metrics in employee metrics are numbers that signal activity, but not necessarily progress. They are attractive because they are easy to count and easy to present. The problem is that they often describe participation, not impact. A metric becomes vanity when it tells you that something happened, but not whether it improved the employee experience, the quality of work, or the business outcome. That is why a strong-looking dashboard can still hide a weak culture.
In employee measurement, the most common vanity metrics tend to show up in a few predictable places. Attendance numbers can look impressive without showing whether people were mentally present. Training completion rates can look healthy without showing whether anyone learned or applied the material. Performance scores can become inflated or flattened by manager bias, making them feel more like labeling exercises than growth measures. Even engagement survey participation can create a sense of progress while revealing very little about whether people trust leadership or believe their feedback will lead to action. Gallup’s engagement work is useful here because it focuses on the workplace conditions that support performance, not just the fact that a survey was completed.
Why leadership teams are drawn to them
Vanity metrics are not popular because leaders are careless. They are popular because they are convenient. They fit neatly into weekly reviews, board updates, and status decks. They also feel safe. It is easier to celebrate a 98% attendance figure than to ask whether people actually understand the work, feel supported, or want to stay. It is easier to report that everyone finished onboarding than to admit that new hires are still confused three months later. That is one reason these numbers keep appearing: they are tidy, and tidy numbers are emotionally reassuring.
The trouble is that tidy is not the same as useful. In employee experience work, a clean dashboard can encourage leaders to move on too quickly. That can be especially misleading in hybrid workplaces, where communication gaps and uneven support are harder to spot if you only track surface-level activity. Auzmor’s own employee experience and communication content reflects this reality: the tools that improve employee life are the ones that help people share ideas, ask questions, and stay connected, not just show up in a system.
The risks of relying on the wrong numbers
The first risk is false confidence. If a team sees strong completion rates or strong attendance, it may assume the underlying system is working. That can delay fixes in onboarding, training, communication, or management. The second risk is misaligned incentives. When managers know they are being judged on the easiest numbers to lift, they optimize for those numbers. Suddenly the goal becomes getting people to click through modules or sit through meetings, not helping them perform better. The third risk is that vanity metrics often punish honesty. If leaders reward neat dashboards, teams may avoid reporting the ugly parts, even when those parts matter most.
This is especially visible in learning and development. Training completion is useful as a hygiene metric, but it is not proof of capability. A completed course may mean the learner reached the final screen. It does not mean they can do the job differently on Monday. The Kirkpatrick Model is helpful here because it moves evaluation beyond attendance and satisfaction into learning, behavior, and results. That framing is much closer to what organizations actually need from learning and development metrics.
What meaningful metrics look like instead
Meaningful metrics do one thing well: they connect employee activity to employee change. They show whether the organization is getting better, not just busier.
In HR analytics, that often means looking at retention, internal mobility, quality of manager support, and time to productivity instead of only counting participation. In onboarding, the better question is not “Did the new hire finish the checklist?” It is “How quickly did the new hire become confident, productive, and connected to the team?” A good onboarding metric should reveal whether the process helped the person start well, not whether it looked complete on paper. Auzmor’s onboarding resources make this point clear by emphasizing structured support, faster ramp-up, and more consistent training experiences.
In employee experience, meaningful metrics focus on trust, clarity, and the ability to do good work. That could include whether employees know where to go for help, whether feedback loops lead to visible action, and whether people feel included across remote and in-office setups. A simple survey response count will not tell you that. A better employee experience lens asks whether the organization is removing friction and making work easier to navigate. Auzmor’s employee experience and feedback-loop content both point in this direction: the goal is not just to gather sentiment, but to improve the conditions that shape it.
In manager effectiveness, the useful metrics are usually behavioral. Are one-on-ones happening consistently? Do employees understand priorities? Are managers coaching, clarifying, and following through? These measures may be slower to gather than attendance counts, but they say far more about whether a team is actually operating well. Gallup’s engagement research also reinforces that the right workplace conditions, such as clear expectations, recognition, development, and resources, are tied to stronger performance outcomes.
A practical way to think about the difference is this:
- Vanity metric: “90% completed training.”
- Meaningful metric: “Did people apply the training and improve performance?”
- Vanity metric: “High survey response rate.”
- Meaningful metric: “Did feedback lead to action?”
- Vanity metric: “Good attendance.”
- Meaningful metric: “Were people engaged, prepared, and productive?”
That shift changes the conversation from reporting activity to improving outcomes.
How to choose better employee metrics
The best employee metrics usually start with a real business or people problem. That sounds obvious, but it is where many measurement programs go wrong. Teams pick a metric because it is easy to collect, then search for a story later. A stronger approach is to work backward from the outcome.
If the goal is better onboarding, decide what “better” means. Faster ramp-up? Fewer repeat questions? Better manager confidence? Higher first-year retention? Then measure the shortest set of signals that show whether those outcomes are improving. If the goal is stronger learning and development, measure whether the learning changed behavior, improved quality, or supported a new role. If the goal is better manager effectiveness, measure clarity, coaching frequency, and follow-through, not just whether managers attended a workshop.
A second rule is to combine metrics instead of relying on one number. For example, a learning program may track completion, but pair it with a short knowledge check, a manager observation, and a business outcome such as fewer errors or faster task completion. That gives the team a much better picture of training effectiveness. The same logic applies to employee experience: survey data becomes more valuable when paired with retention data, feedback-loop follow-up, or participation in growth programs like career pathing. Auzmor’s career pathing and development resources fit naturally into that model because they connect learning to progression instead of treating learning as a one-time event.
A third rule is to make the metric actionable. If a number changes, who should do what next? If there is no clear owner or next step, the metric is probably decorative. Meaningful metrics should lead to a decision: adjust the onboarding flow, coach the manager, revise the training content, improve communication, or simplify a process. If the number cannot guide action, it is probably not worth the reporting overhead.
How technology can help without making things more complicated
Technology should make measurement clearer, not noisier. That is the real value of platforms in HR and L&D. Good systems reduce manual reporting, centralize data, and help teams connect learning, communication, onboarding, and feedback in one place. They also make it easier to move from isolated metrics to connected ones. For example, if learning data can be tied to manager follow-up or career progression, the organization gets a much richer picture than it would from completion totals alone.
This is where a platform like Auzmor can be useful in practice. When employee experience, communication, training, and development live in separate systems, teams often end up measuring fragments. When those pieces are better connected, it becomes easier to see whether people are actually learning, growing, and staying engaged. The technology should not add complexity for the sake of it. It should help leaders ask better questions and make faster decisions. That is especially important in hybrid workplaces, where signals can be easy to miss unless the organization is intentionally looking for them.
What teams should remember
Vanity metrics are not always useless. They can be a starting point. The problem begins when they become the finish line. A healthy people strategy needs metrics that reflect trust, capability, growth, retention, and manager effectiveness, not just activity. The question is never “Can we report this number?” It is “Does this number help us improve the employee experience and the work itself?”
That is the real test. And for organizations trying to move beyond surface-level reporting, the answer usually starts with better questions, clearer outcomes, and a measurement system that values substance over appearance. Auzmor’s employee experience and learning resources fit naturally into that approach, because the goal is not to collect more dashboards. It is to help people do better work.